
Mentre Stephen Wolfram presentava Wolfram Alpha, Google lanciava public data on Google
La guerra si fa aperta in uno dei settori più critic della ricerca in rete: quello delle ricerche strutturate fra grandi moli di dati statistici più o meno aggregati.
This afternoon in Boston, the Berkman Center at Harvard put on a live online demonstration of Wolfram Alpha, the forthcoming “knowledge engine” with a name better suited to a preening science fiction supervillain.
…
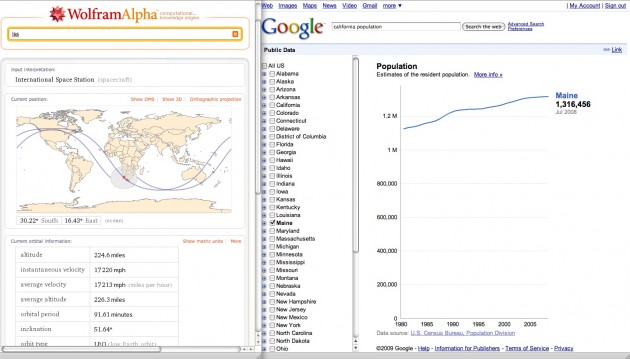
• It is a web search engine, but it’s a search engine that is on the web, not an engine that searches the web. It’s essentially a front end to a enormous, interlinked database of verified – usually academic – information. Putting in terms throws back charts, graphs and other answers around the subject you’re quizzing it about. (no surprise that Google‘s decided that now is a good time to show off its new charts display)
• There’s a lot of data drawn from the hard sciences, engineering and so on. There’s a lot from Mathematica, the computational software Wolfram also makes. Not so much input from pop culture or the day to day world of fleeting information and consumption. To get an idea of what the system knows, Wolfram claims that “probably 90% of the shelves in a reference library we can say we’ve got a reasonable start on”.
• It’s a bit like a semantic web application, but the ontologies and structures are peculiar. “If the semantic web had been a 100%, overwhelming thing in the world, our job would have been a lot easier,” he said, adding that at some point he hopes to “expose some of our data depository mechanism” to the public.
• The business model is fairly familiar. There will be a free, online front end that can be accessed by anyone. The site will have messages from what Wolfram called “corporate sponsors” (in other words, display adverts) and these will be supplemented in the future by “vendor-provided information” (targeted adverts). There will also be a paid-for, pro version for people who want to use the system to interrogate their own data.
• It’s not really doing any natural language processing – that is, in Wolfram’s words, the engine actually gets rid of “pure linguistic fluffery” and really just understands keywords and operators. He expects people to quickly stop using natural language and start using the relevant jargon.
Google has started to showcase charts on its search results page created from public data, allowing users to compare unemployment rates and population trends.
The initiative, announced today, is part of a broader effort by the Mountain View Internet company to make government information – often overlooked on poorly organized agency Web site – more accessible.
Users who enter a query like “California unemployment rate” into Google will get chart that illustrates the rate in the state since 1990. Clicking on it opens a bigger version and offers users the ability to refine the data by county, or compare the rates in different counties.
Similar charts are available for users who enter a query like “Alameda County population.”
Although Google creates the charts, the data comes from the U.S. Bureau of Labor Statistics and the Census Bureau. More types of information will be added in the future, Google said.
It is the first time that Google is creating and showcasing charts, within its search results, to help users better visualize data. The new tool was spawned by Google’s 2007 acquisition of Trendalyzer, software for illustrating data.
Il video da Google